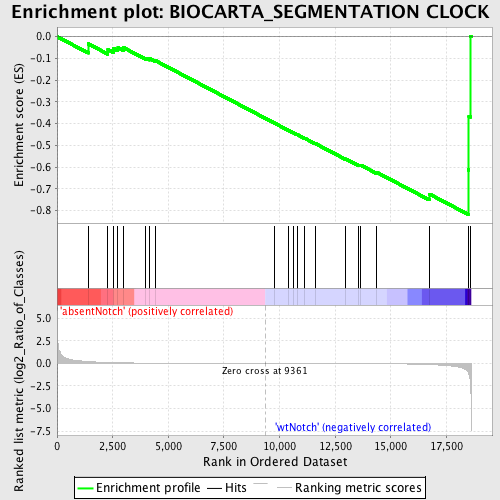
Profile of the Running ES Score & Positions of GeneSet Members on the Rank Ordered List
| Dataset | Set_03_absentNotch_versus_wtNotch.phenotype_absentNotch_versus_wtNotch.cls #absentNotch_versus_wtNotch.phenotype_absentNotch_versus_wtNotch.cls #absentNotch_versus_wtNotch_repos |
| Phenotype | phenotype_absentNotch_versus_wtNotch.cls#absentNotch_versus_wtNotch_repos |
| Upregulated in class | wtNotch |
| GeneSet | BIOCARTA_SEGMENTATION CLOCK |
| Enrichment Score (ES) | -0.8181732 |
| Normalized Enrichment Score (NES) | -1.5589865 |
| Nominal p-value | 0.02631579 |
| FDR q-value | 0.22533616 |
| FWER p-Value | 0.995 |
| PROBE | DESCRIPTION (from dataset) | GENE SYMBOL | GENE_TITLE | RANK IN GENE LIST | RANK METRIC SCORE | RUNNING ES | CORE ENRICHMENT | |
|---|---|---|---|---|---|---|---|---|
| 1 | GSK3B | 5360348 | 1401 | 0.203 | -0.0330 | No | ||
| 2 | LFNG | 5360711 | 2283 | 0.103 | -0.0590 | No | ||
| 3 | NKD2 | 1170731 | 2531 | 0.086 | -0.0544 | No | ||
| 4 | WIF1 | 7100184 | 2734 | 0.074 | -0.0499 | No | ||
| 5 | ADAM17 | 360292 | 2989 | 0.061 | -0.0508 | No | ||
| 6 | LRP6 | 5130064 | 3994 | 0.031 | -0.0984 | No | ||
| 7 | DLL1 | 1770377 | 4165 | 0.028 | -0.1017 | No | ||
| 8 | RBPJ | 2360164 5550136 5720402 | 4423 | 0.024 | -0.1105 | No | ||
| 9 | PROC | 6520270 | 9768 | -0.001 | -0.3977 | No | ||
| 10 | HEY2 | 3990504 | 10412 | -0.003 | -0.4317 | No | ||
| 11 | HES7 | 4610239 | 10627 | -0.003 | -0.4425 | No | ||
| 12 | FZD1 | 3140215 | 10800 | -0.004 | -0.4509 | No | ||
| 13 | DKK2 | 3610433 | 11106 | -0.005 | -0.4663 | No | ||
| 14 | KREMEN2 | 110025 | 11597 | -0.007 | -0.4913 | No | ||
| 15 | CSNK2A1 | 1580577 | 12976 | -0.013 | -0.5627 | No | ||
| 16 | WNT1 | 4780148 | 13567 | -0.018 | -0.5907 | No | ||
| 17 | NKD1 | 1340286 | 13643 | -0.018 | -0.5909 | No | ||
| 18 | DKK1 | 1940215 | 14346 | -0.027 | -0.6231 | No | ||
| 19 | AXIN1 | 3360358 6940451 | 16733 | -0.131 | -0.7242 | Yes | ||
| 20 | HES1 | 4810280 | 18482 | -0.988 | -0.6125 | Yes | ||
| 21 | DVL1 | 5900450 6510162 | 18509 | -1.188 | -0.3667 | Yes | ||
| 22 | PSEN1 | 130403 2030647 6100603 | 18571 | -1.789 | 0.0024 | Yes |

